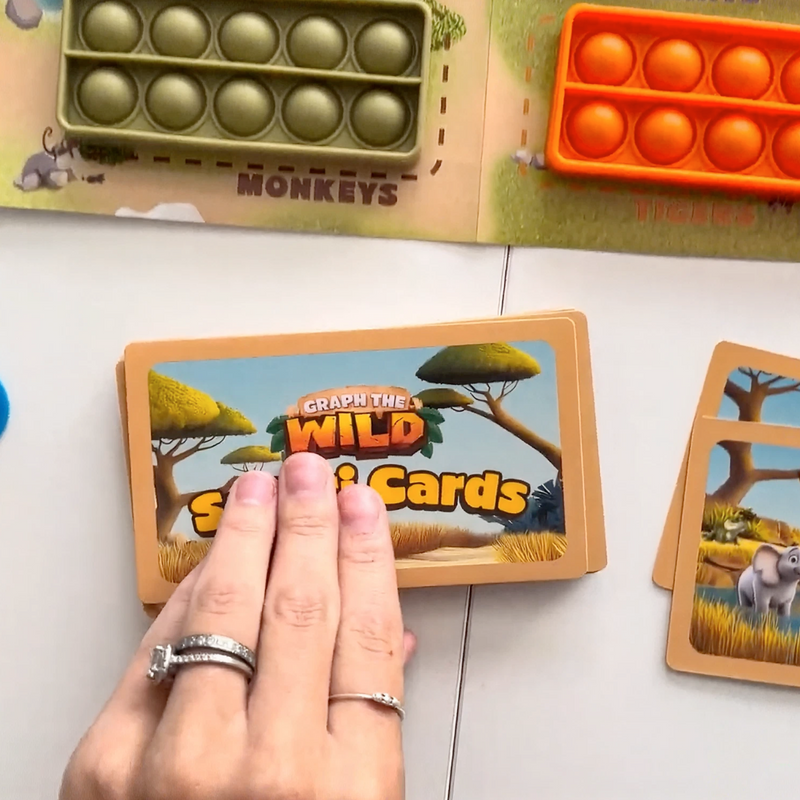
40 Safari Cards
1
/
of
0
Educator CreatedDesigned by teachers
30-day returnshassle-free
Secure paymentsSSL encrypted
Ships in 3 daysfrom the US
Kindergarten
Grade 1
Grade 2
Grade 3-5
Graph the Wild
Graph the Wild
Regular price
$0.00
Sale price
$0.00
Regular price
Unit price
/
per
Couldn't load pickup availability
What's Inside The Box
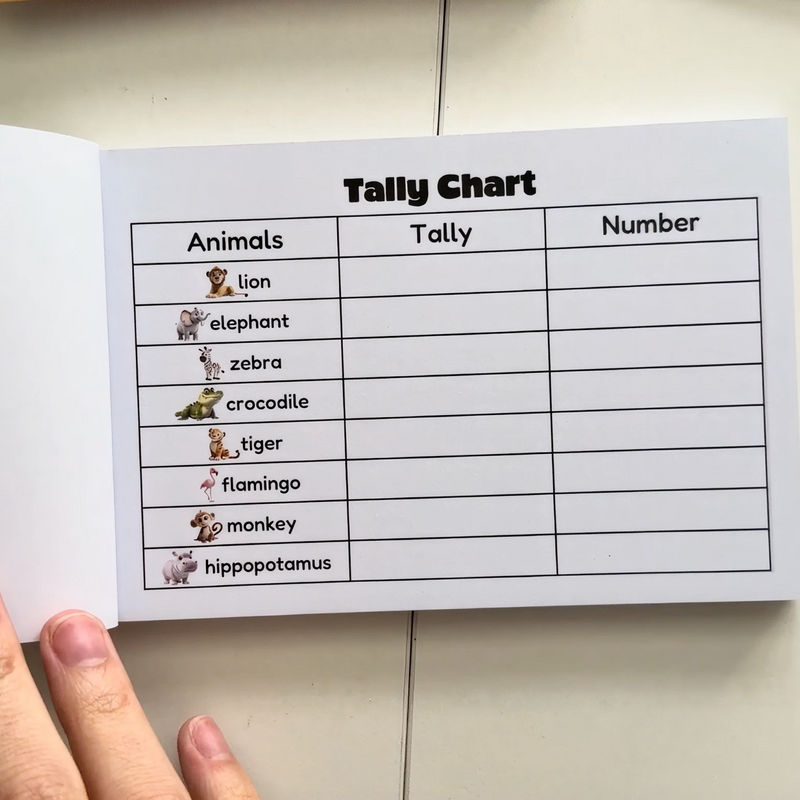
1 Graph Notebook
1 Spinner
1 Safari Sighting Map
8 Ten Frame Fidgets
1 Sand Timer
Skills Covered After 30 Days
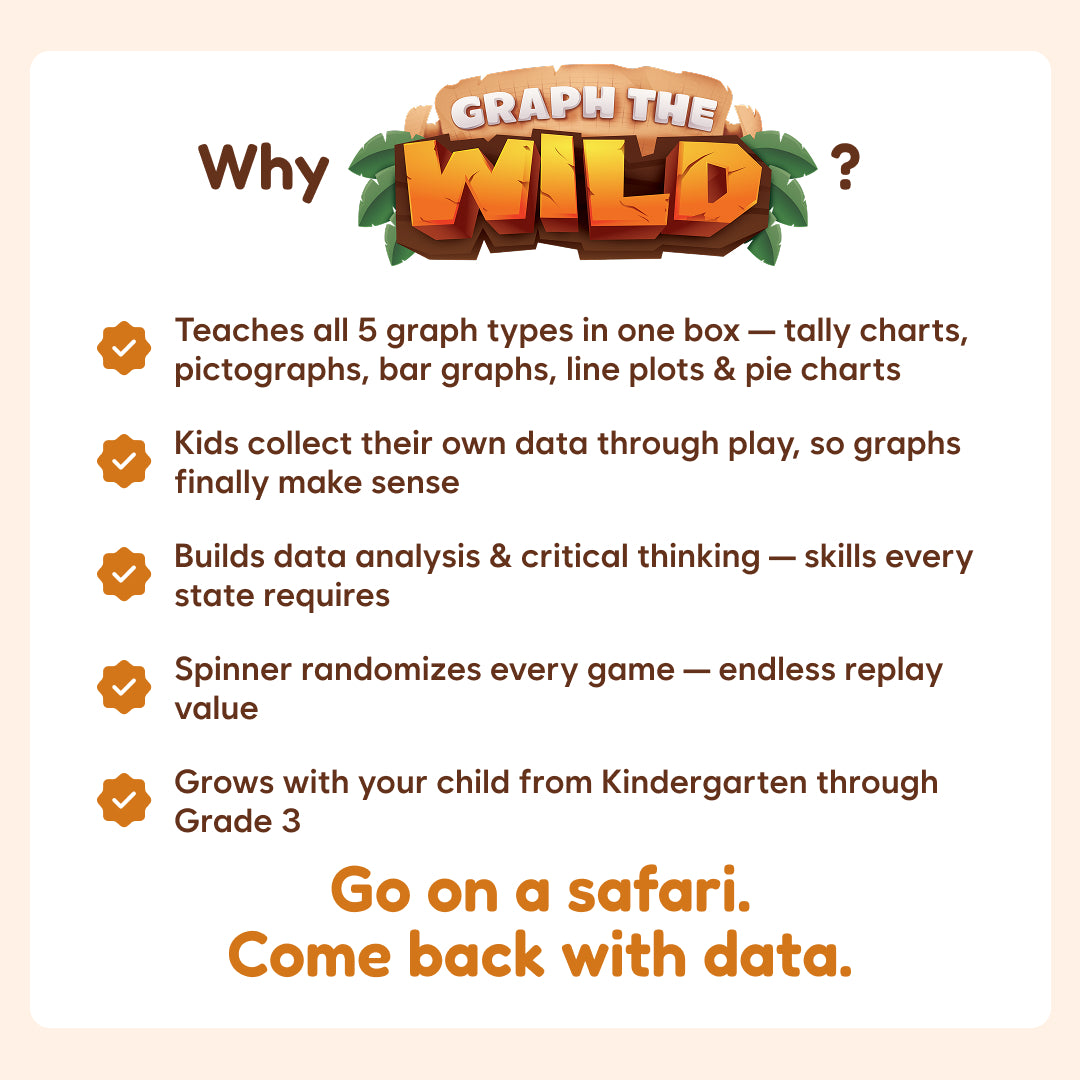
- Teaches graphing through hands-on play: tally charts, pictographs, bar graphs, line plots, and pie charts
- Builds data analysis and critical thinking skills
- Makes data easy to understand with visual, concrete learning
- Turns graphing practice into fun, engaging gameplay
Key Features
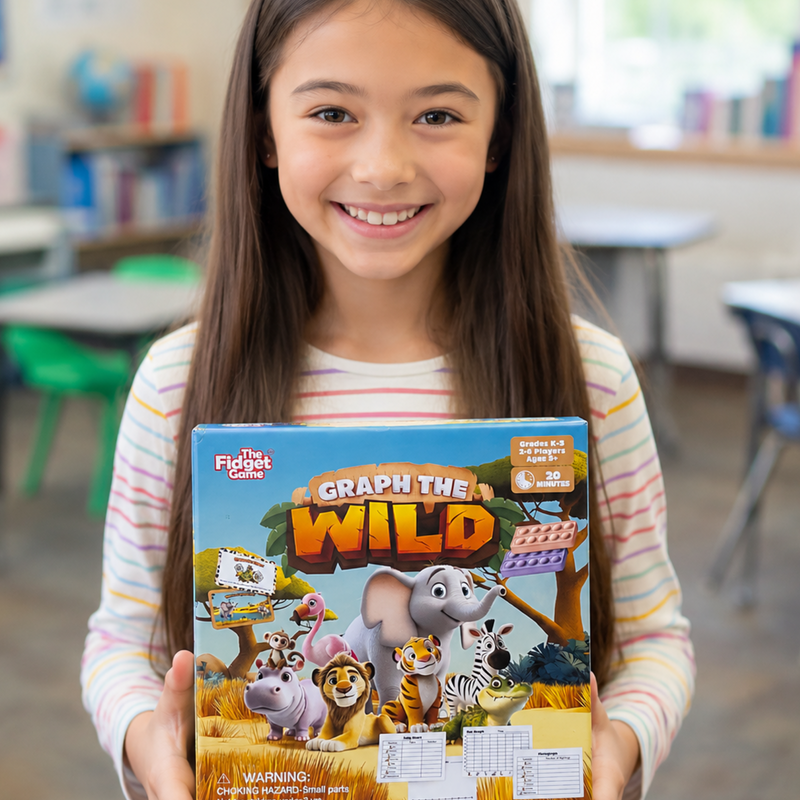
- 2 to 6 players
- Ages 5 to 9 (Grades K-3)
- Quick and Easy Play (15 to 20 min)
Educational Standards
Common Core
- CCSS.Math.Content.K.MD.B.3 Classify objects into given categories; count the numbers of objects in each category and sort the categories by count.
- CCSS.Math.Content.1.MD.C.4 Organize, represent, and interpret data with up to three categories; ask and answer questions about the total number of data points, how many in each category, and how many more or less are in one category than in another.
- CCSS.Math.Content.2.MD.D.10 Draw a picture graph and a bar graph (with single-unit scale) to represent a data set with up to four categories. Solve simple put-together, take-apart, and compare problems using information presented in a bar graph.
- CCSS.Math.Content.3.MD.B.3 Draw a scaled picture graph and a scaled bar graph to represent a data set with several categories. Solve one- and two-step "how many more" and "how many less" problems using information presented in scaled bar graphs.
TEKS
- K.8A: Collect, sort, and organize data into two or three categories.
- K.8B: Use data to create real-object and picture graphs.
- K.8C: Draw conclusions from real-object and picture graphs.
- 1.8B: Use data to create picture and bar-type graphs.
- 1.8C: Draw conclusions and generate and answer questions using information from picture and bar-type graphs.
- 2.10A: Explain that the length of a bar in a bar graph or the number of pictures in a pictograph represents the number of data points for a given category.
- 2.10B: Organize a collection of data with up to four categories using pictographs and bar graphs with intervals of one or more.
- 2.10D: Draw conclusions and make predictions from information in a graph.
- 3.8A: Summarize a data set with multiple categories using a frequency table, dot plot, pictograph, or bar graph with scaled intervals.
B.E.S.T.
- MA.K.DP.1.1 Collect and sort objects into categories and compare the categories by counting the objects in each category. Report the results verbally, with a written numeral or with drawings.
- MA.1.DP.1.1 Collect data into categories and represent the results using tally marks or pictographs.
- MA.1.DP.1.2 Interpret data represented with tally marks or pictographs by calculating the total number of data points and comparing the totals of different categories.
- MA.2.DP.1.1 Collect, categorize and represent data using tally marks, tables, pictographs or bar graphs. Use appropriate titles, labels and units.
- MA.2.DP.1.2 Interpret data represented with tally marks, tables, pictographs or bar graphs including solving addition and subtraction problems.
- MA.3.DP.1.1 Collect and represent numerical and categorical data with whole-number values using tables, scaled pictographs, scaled bar graphs or line plots. Use appropriate titles, labels and units.
- MA.3.DP.1.2 Interpret data with whole-number values represented with tables, scaled pictographs, circle graphs, scaled bar graphs or line plots by solving one- and two-step problems.
Ontario
Kindergarten
- OE20 explore, sort, classify, and compare objects using one attribute
- OE21 collect, organize, display, and interpret data using concrete graphs and charts
Grade 1
- D1.1 sort, classify, and organize data using one attribute
- D1.2 collect data and organize it into pictographs and tally charts
- D1.3 read and interpret data presented in graphs
Grade 2
- D1.1 collect, organize, and display data using tally charts, pictographs, and bar graphs
- D1.2 read and interpret graphs to draw conclusions
Grade 3
- D1.1 collect and organize discrete data using tally charts, bar graphs, pictographs, and line plots
- D1.2 display data using scaled graphs
- D1.3 read, interpret, and analyze data
British Columbia
Kindergarten
- Sort objects and classify data using one attribute
- Demonstrate understanding of data by creating concrete graphs
Grade 1
- Demonstrate understanding of data by sorting and organizing into graphs, including pictographs
- Interpret graphs to answer questions
Grade 2
- Collect, organize, and represent data using pictographs and bar graphs
- Interpret data in graphs
Grade 3
- Collect, organize, and represent data using pictographs, bar graphs, and line plots
- Analyze and interpret data
Alberta
Kindergarten
- Children collect and organize information using concrete objects
- Children interpret simple data displays
Grade 1
- Students collect, organize, and represent data using concrete graphs
- Students interpret graphs
Grade 2
- Students collect and organize data using tally charts and bar graphs
- Students interpret data displays
Grade 3
- Students represent data using bar graphs and pictographs
- Students analyze and interpret data
Manitoba
Kindergarten
- K.SP.1 Collect and organize data using concrete objects
- K.SP.2 Construct and interpret concrete graphs
Grade 1
- 1.SP.1 Collect, organize, and represent data using pictographs
- 1.SP.2 Interpret data presented in graphs
Grade 2
- 2.SP.1 Construct and interpret pictographs and bar graphs
- 2.SP.2 Collect and record data using tally marks
Grade 3
- 3.SP.1 Construct and interpret bar graphs and pictographs
- 3.SP.2 Analyze data displays
New Brunswick
Kindergarten
- K.SP.1 Collect and organize data using concrete graphs
- K.SP.2 Interpret simple graphs
Grade 1
- 1.SP.1 Construct pictographs to represent data
- 1.SP.2 Interpret pictographs
Grade 2
- 2.SP.1 Construct and interpret bar graphs
- 2.SP.2 Collect data using tally charts
Grade 3
- 3.SP.1 Construct and interpret bar graphs and pictographs
- 3.SP.2 Draw conclusions from data
Newfoundland & Labrador
Kindergarten
- SCO KSP1 Collect and organize data using concrete objects
- SCO KSP2 Construct and interpret concrete graphs
Grade 1
- SCO 1SP1 Construct pictographs
- SCO 1SP2 Interpret pictographs
Grade 2
- SCO 2SP1 Construct and interpret bar graphs
- SCO 2SP2 Use tally marks to collect data
Grade 3
- SCO 3SP1 Construct bar graphs and pictographs
- SCO 3SP2 Interpret and analyze graphs
Nova Scotia
Kindergarten
- K.SP.1 Collect and organize data using concrete objects
- K.SP.2 Interpret concrete graphs
Grade 1
- 1.SP.1 Construct pictographs
- 1.SP.2 Interpret pictographs
Grade 2
- 2.SP.1 Construct and interpret bar graphs
- 2.SP.2 Collect data using tally marks
Grade 3
- 3.SP.1 Construct and interpret graphs
- 3.SP.2 Analyze data
Prince Edward Island
Kindergarten
- K.SP.1 Collect and organize data using concrete graphs
Grade 1
- 1.SP.1 Construct pictographs
- 1.SP.2 Interpret pictographs
Grade 2
- 2.SP.1 Construct and interpret bar graphs
- 2.SP.2 Collect data using tally marks
Grade 3
- 3.SP.1 Construct bar graphs and pictographs
- 3.SP.2 Interpret data displays
Saskatchewan
Kindergarten
- SK.SP.1 Collect and organize data using concrete objects
- SK.SP.2 Interpret concrete graphs
Grade 1
- SP1.1 Collect and organize data using pictographs
- SP1.2 Interpret pictographs
Grade 2
- SP2.1 Construct and interpret bar graphs
- SP2.2 Collect data using tally marks
Grade 3
- SP3.1 Construct and interpret bar graphs and pictographs
- SP3.2 Analyze data displays
Our games are used in 50,000+ classroomsSpecial discounts for school districts and homeschoolers.
Get a Quote
Skills Built
What skills does Graph the Wild build?
📊
Graphing
Turning number data into a picture
30-Day Money Back Guarantee
* Results based on internal study with regular users. Individual results may vary.
You ask, we answer!
What is the return policy?
We offer a 30-day return policy for eligible items.